Update: This blog post was edited on April 8, 2022, to provide clarification on Cynet’s results interpretation.
Like the swallows returning to Capistrano, the month of March also signals the return of the MITRE ATT&CK Evaluation results. MITRE ATT&CK testing has become the defacto source for quantitative assessments of a cybersecurity vendor’s ability to protect against real-world threats.
This testing is critical for evaluating vendors because it’s virtually impossible to evaluate cybersecurity vendors based on their own performance claims (yes, some do exaggerate quite a bit). Along with vendor client references and proof of value (POV) evaluations – a live trial – in their environment, the MITRE results add additional objective input for evaluating cybersecurity vendors.
In this blog, we’ll explain how MITRE Engenuity tests security vendors during their evaluation, how we have interpreted the results, and the top takeaways coming out of Cynet’s evaluation this year.
How does MITRE Engenuity test vendors during the evaluation?
The MITRE ATT&CK Evaluation is performed by MITRE Engenuity and tests the endpoint protection solutions against a simulated attack sequence based on real-life approaches taken by well-known advanced persistent threat (APT) groups. The 2022 MITRE ATT&CK Evaluation included 30 vendor solutions using attack sequences based on the Wizard Spider and Sandworm threat groups.
It’s always important to note that MITRE does not rank or score vendor results. Instead, the raw test data is published along with some basic online comparison tools. Buyers can use the data to evaluate the vendors as they see fit based on their organization’s unique priorities and needs. The participating vendors’ interpretations of the results are just that – their interpretations. MITRE does not interpret the results or review other’s analysis.
So, how do you interpret the results?
That’s a great question – one that a lot of people are asking themselves right now. The MITRE ATT&CK Evaluation results aren’t presented in a format that many of us are used to digesting (we’re looking at you, four quadrant graph).
Independent researchers often declare “winners,” taking the cognitive load off of us when it comes to figuring out which vendors are the top performers. In this case, identifying the “best” vendor is subjective. This isn’t particularly helpful when you’re already frustrated with trying to assess which security vendor is the right fit for your organization.
Stay tuned because we’ll be sharing a guide that walks you through how to interpret the results and will provide a deep dive into how Cynet performed compared to the other vendors who participated in this year’s evaluation. So, if you haven’t subscribed to our blog yet, now’s the time to do it.
MITRE ATT&CK Results Summary
The following table presents Cynet’s analysis and calculation of all vendor MITRE ATT&CK test results for Overall Detection, Overall Prevention, and a Total Rating.
Cynet’s formula for Detection Rate is the total number of attack steps detected across all 109 sub-steps (MITRE Engenuity defines this metric as “Visibility”). Cynet defines Prevention Rate as the percentage of attack sub-steps that did not execute due to the vendor detecting and blocking the threat early in the attack lifecycle, thus not allowing additional malicious sub-steps to execute.
Note that testing in the Linux environment and testing for protection were optional for vendors in this year’s evaluation. There were nine broad tests in the Protection evaluation and 109 steps in the Detection evaluation, but those numbers dropped to eight and 90, respectively, for vendors who didn’t participate in the Linux tests. All calculations are based on the number tests that each vendor participated in.
How’d Cynet do?
According to Cynet’s analysis, we performed strongly in this year’s MITRE ATT&CK Evaluation, outperforming the majority of vendors in several key areas.
Here are the top takeaways from Cynet’s interpretation of our results:
- Cynet achieved 100% visibility and detection across all of the 19 MITRE ATT&CK steps evaluated.
- Cynet achieved 100% protection rate across nine tests conducted by MITRE Engenuity.
- Cynet achieved 93.6% analytic coverage (102 of 109 sub-steps).
- Cynet is the #3 vendor in number of prevented attacks and in speed of prevention in total
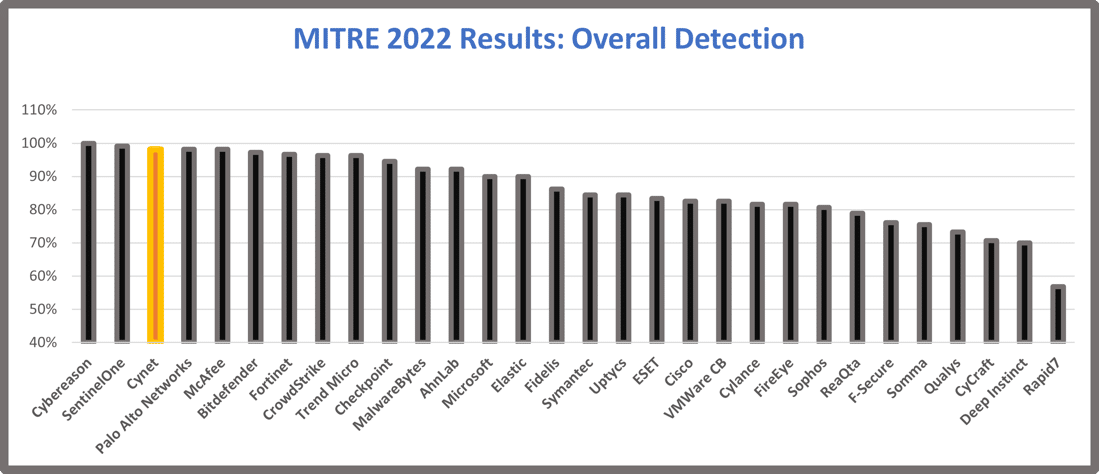
- Cynet is the #3 vendor in detection coverage (visibility=98.2%) across all sub-steps (107 of 109 sub-steps) conducted in the MITRE ATT&CK Evaluation
- Cynet detected 98.5% of the techniques presented (65 of 66 unique techniques) in the MITRE ATT&CK Evaluation, demonstrating the platform’s ability to provide visibility and protection across the entire ATT&CK® Kill Chain.
Let’s dive a little deeper into Cynet’s analysis of the results.
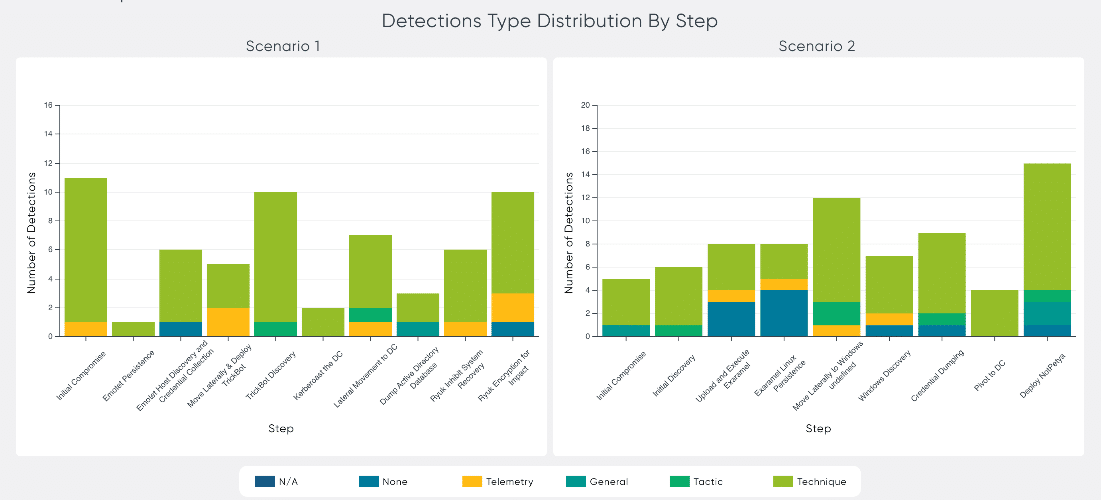
Cynet provided 100% visibility and detection across each of the 19 MITRE ATT&CK steps evaluated. That is, Cynet was able to detect some part of every one of the 19 unique attack steps.
Cynet detected 98.5% of the techniques presented across the Windows and Linux systems tested. Overall detection is a key measure of an endpoint protection solution’s effectiveness.
Cynet’s analysis of Overall Detection rate
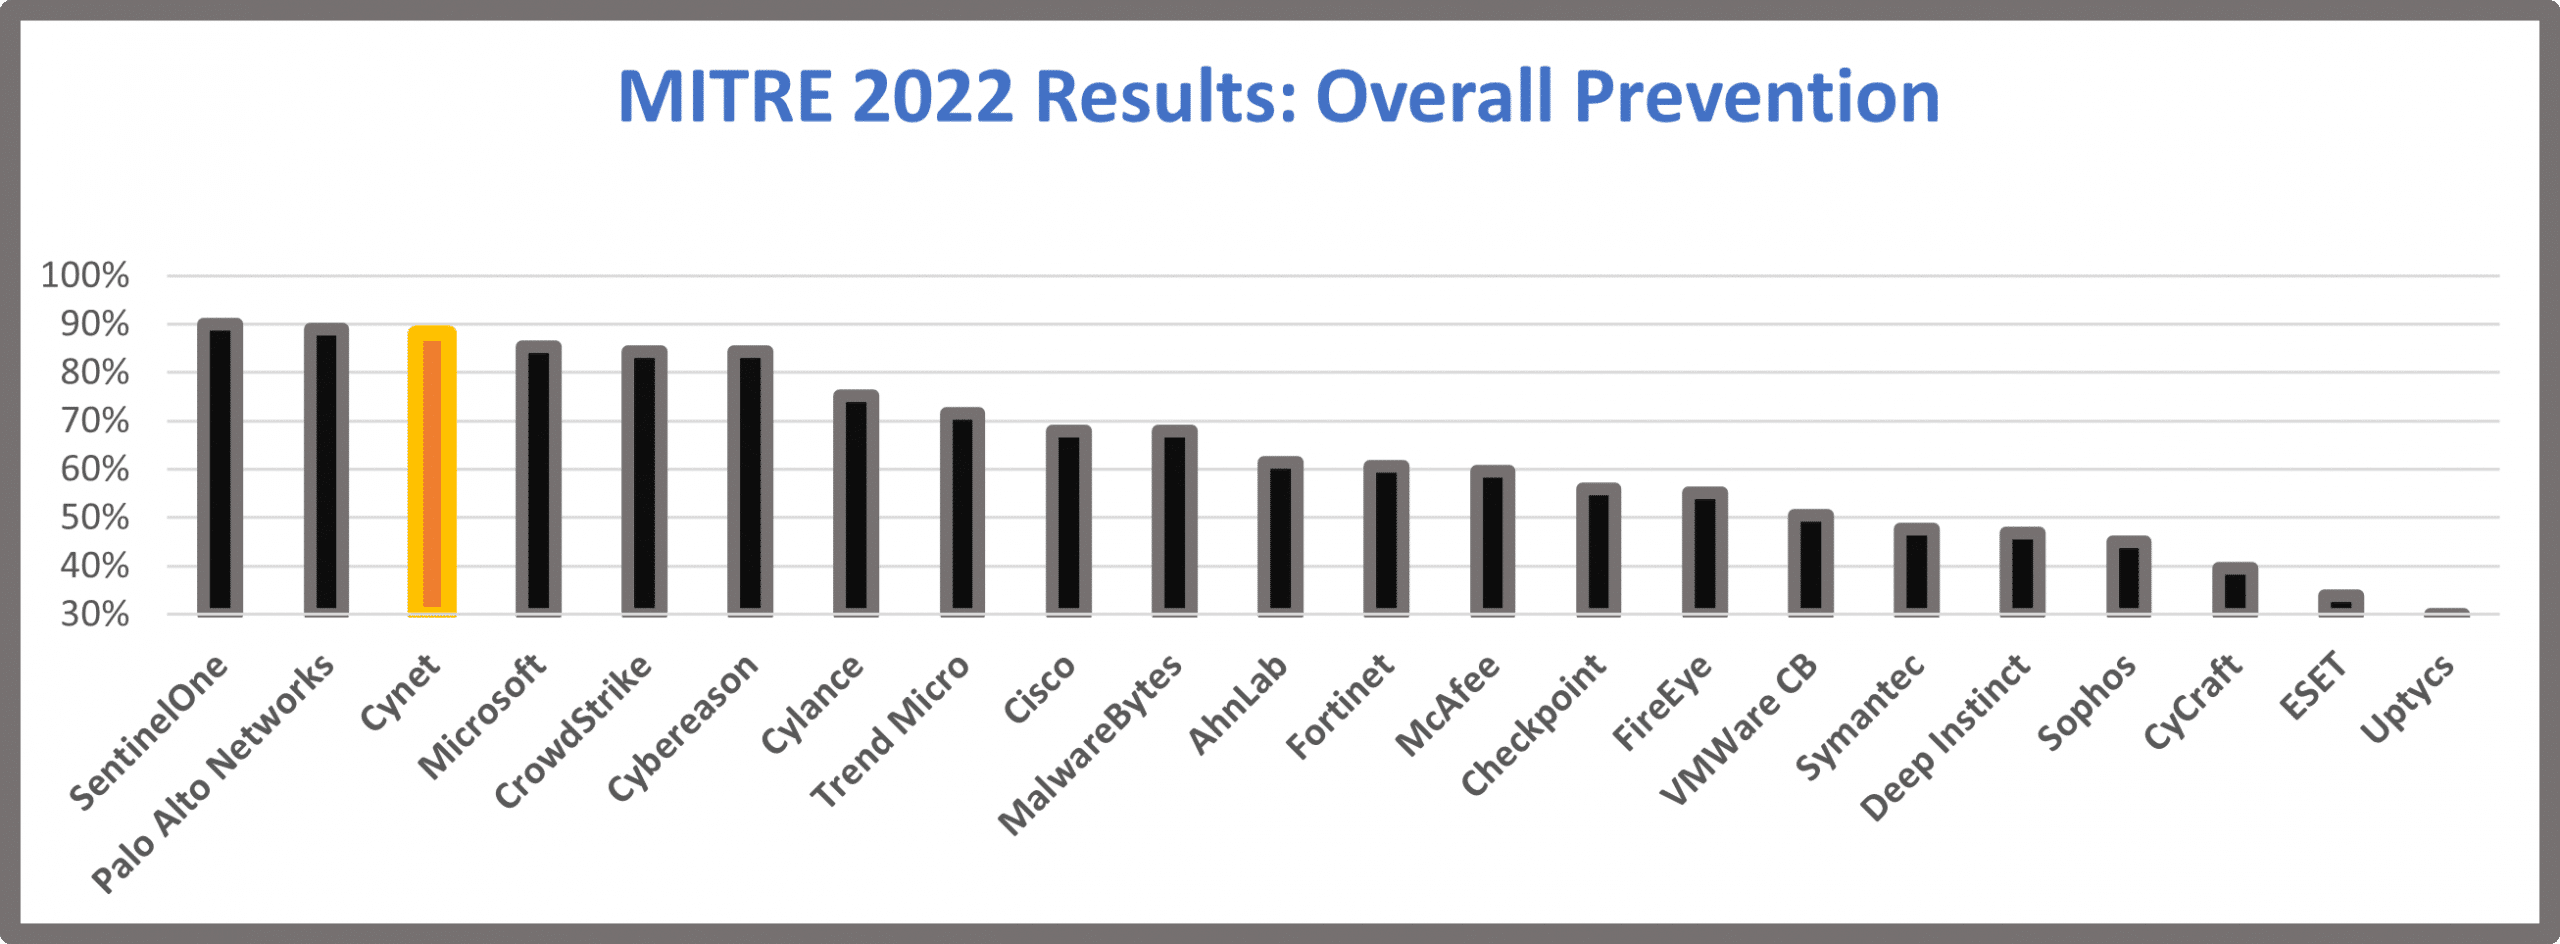
Cynet prevented 88% of attacks before any further infiltration (sub-steps) could take place in the test environment. Cynet’s prevention capabilities were among the three top performers.
Cynet’s analysis of Overall Prevention rate
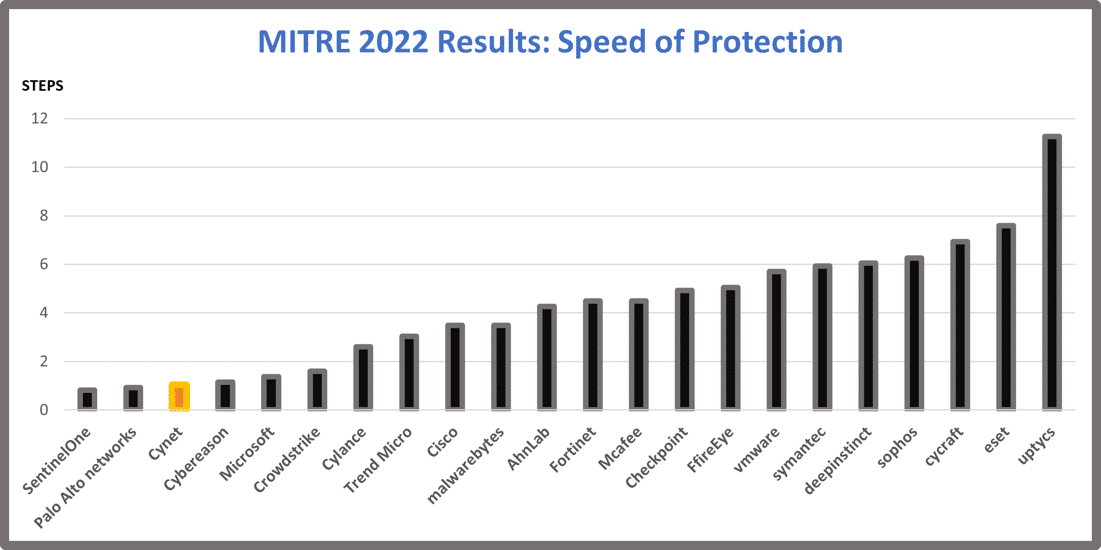
Cynet was among the top three performers in speed of protection. Cynet defines speed of protection as the average number of steps executed at each test before the attack was detected and blocked. Detecting and preventing detected threats as early as possible in the attack lifecycle is critical in order to deny the adversary a foothold into your environment.
Cynet’s analysis of Speed of Protection rate
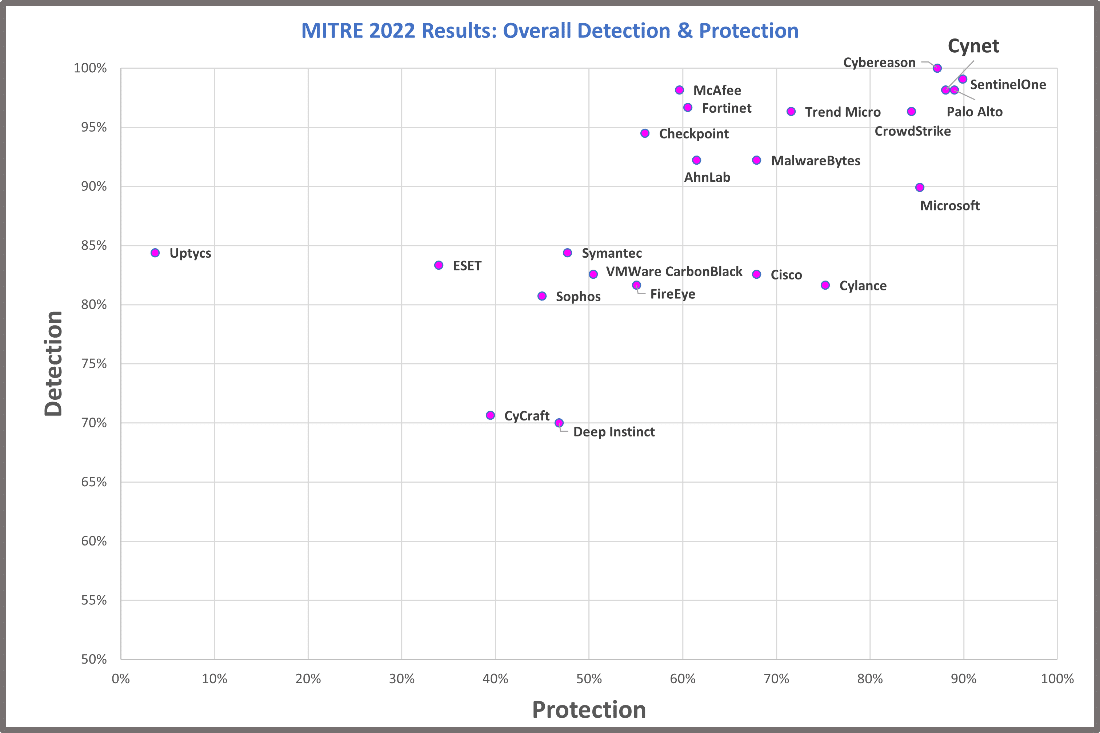
Another interesting perspective is comparing Overall Detection with Overall Protection. Again, Overall Detection is the total number of attack steps detected across all sub-steps the vendor participated in. Overall Prevention measures how early in the attack sequence the threat was detected so that subsequent steps could not execute. Note that in this testing environment, the sequences were modelled to isolate specific behaviors rather than full chains of behaviors.
Both are important measurements and are indicative of a strong endpoint detection solution. Cynet was among the top four performers in this year’s test.
Note that vendors that did not participate in the Protection tests are not included in the following chart.
Cynet’s Analysis of Overall Detection & Protection
Still have questions?
Understandable.
Join our CTO, Aviad Hasnis, for a webinar series starting on April 7, where he’ll explain how you can interpret these results and use the data to inform your vendor assessment. He’ll also share more details on Cynet’s performance during the tests and how that translates to your organization’s specific needs.
Sign up for the live webinar: 2022 MITRE ATT&CK Evaluation Results
For full results and more information about the evaluations, please visit: https://attackevals.mitre-engenuity.org/enterprise/wizard-spider-and-sandworm/.


